Fast Insights into Differential Expression: Validating Differences in Breast Cancer Fibroblasts Using a Volcano Plot
Unlock rapid RNA-seq discoveries—no coding required. Learn how Aimed Analytics instantly highlights TGFA, SFRP1 and MMP3 shifts between pre-invasive and invasive breast-cancer fibroblasts, serving up publication-ready volcano plots in minutes. Step inside a code-free pipeline that turns raw data into decisive tumor-microenvironment insights—and accelerates your next breakthrough.
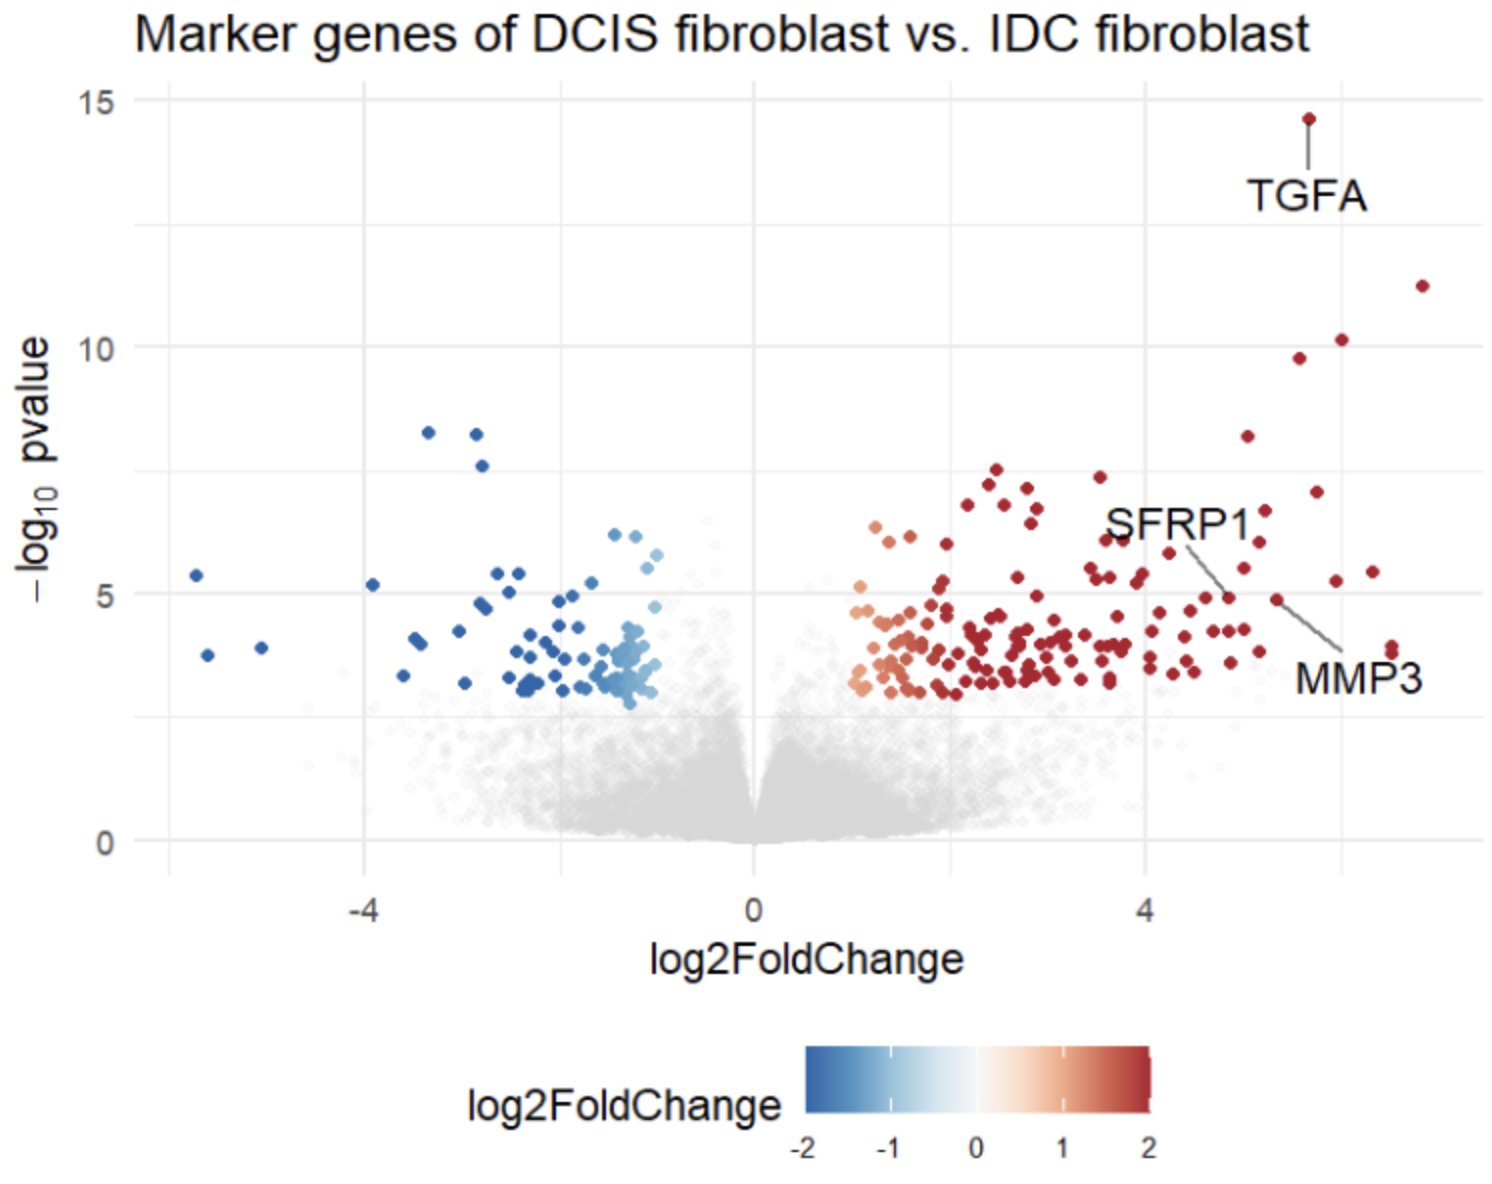
Leveraging the Aimed Analytics platform, researchers can rapidly validate critical molecular changes in the tumor microenvironment without writing any code. In a recent study based on Fang et al. (2023) (Frontiers | Transcriptome analysis reveals differences in cell cycle, growth and migration related genes that distinguish fibroblasts derived from pre-invasive and invasive breast cancer), our automated pipeline reproduced key findings from RNA sequencing data comparing fibroblasts derived from pre‐invasive (DCIS) and invasive (IDC) breast cancers. The analysis is visualized via a volcano plot that clearly delineates significant gene expression differences.
KEY CHALLENGES IN THE BIOLOGICAL AREA
Complex Data Interpretation: Dissecting raw RNA-seq data to reliably pinpoint statistically significant gene expression changes is inherently challenging.
Visualizing Differential Expression: Translating numerical data into clear, intuitive visual summaries—such as volcano plots—can be labor-intensive using traditional methods.
Resource Intensive: Conventional analysis methods require extensive manual coding and processing time, potentially delaying insights.
ADVANTAGES
Automated DE Analysis: Our platform executes robust differential expression analyses automatically, streamlining the process from raw data to visual insights.
Code-Free Usability: The intuitive, user-friendly interface eliminates the need for programming skills, opening advanced omics analysis to a broader audience.
Comprehensive Visualization: The integrated volcano plot provides a clear and immediate depiction of fold changes and statistical significance, making it easy to identify key molecular markers such as TGFA, SFRP1, and MMP3.
USE CASE
a. Context
RNA sequencing data from fibroblasts isolated from pre‐invasive (DCIS) and invasive (IDC) breast cancers were analyzed using our platform. This approach was employed to reproduce and validate the differential expression findings reported in Fang et al. (2023), focusing on molecular changes in the tumor microenvironment.
b. Analytical Steps
Data Upload: Upload RNA-seq datasets for both DCIS and IDC fibroblasts.
Phrase Question: We asked in the chat area, which genes were differentially expressed.
Differential Expression Analysis: The platform automatically processed the data to identify differentially expressed genes.
Volcano Plot Visualization: Results were visualized using a volcano plot, clearly depicting statistically significant differences.
c. Outcome
The automated pipeline confirmed a distinct molecular signature in DCIS fibroblasts compared to IDC fibroblasts. DCIS fibroblasts exhibited upregulation of the following key genes:
TGFA: Promotes paracrine signaling driving tumor growth and invasion.
SFRP1: Indicates a role in early tumor-stroma interactions, despite its known function as a Wnt pathway antagonist.
MMP3: Suggests enhanced extracellular matrix remodeling that facilitates cancer invasion.
By validating the upregulation of important markers through a clear volcano plot, the platform demonstrated its efficiency in transforming complex transcriptomic data into actionable, reproducible insights.
PRACTICAL BENEFITS FOR ORGANIZATIONS AND RESEARCHERS
Accelerated Discovery: Rapid identification of key prognostic biomarkers expedites further studies or therapeutic interventions.
Operational Efficiency: Automating DE analysis drastically reduces manual effort and coding requirements.
Data-Driven Decisions: Clear visual tools like volcano plots enhance confidence in interpreting differential expression results.
Broad Applicability: The code-free, streamlined process makes advanced omics analysis accessible to research teams with varying levels of technical expertise.
TIME TO GET STARTED
Experience fast, automated differential expression analysis with our aimed analytics platform. Simply upload your RNA-seq data from breast cancer fibroblasts, phrase your question, and receive clear, actionable insights via a comprehensive volcano plot—all without any coding.
CONCLUSION
The aimed analytics platform transforms complex RNA-seq datasets into clear, reproducible insights. By validating key molecular changes in breast cancer fibroblasts using an intuitive volcano plot, researchers can rapidly progress from raw data to informed, data-driven decisions that facilitate new discoveries in tumor biology.
WANT TO LEARN MORE?
Explore how our platform can revolutionize your differential expression analysis:
Schedule a Demo: Witness the platform’s intuitive, code-free interface in action.
Contact Us: Get personalized support to integrate our solution into your research workflow.